Turn raw spreadsheet exports intoDashboard + Insights in minutes
Upload CSV or Excel exports and move faster from messy rows to KPI cards, charts, executive summaries, and report-ready insights.
Upload CSV or Excel exports from the tools you already use
Check if the file is dashboard-ready before generating a preview
Use templates only when you still need a clean starting structure
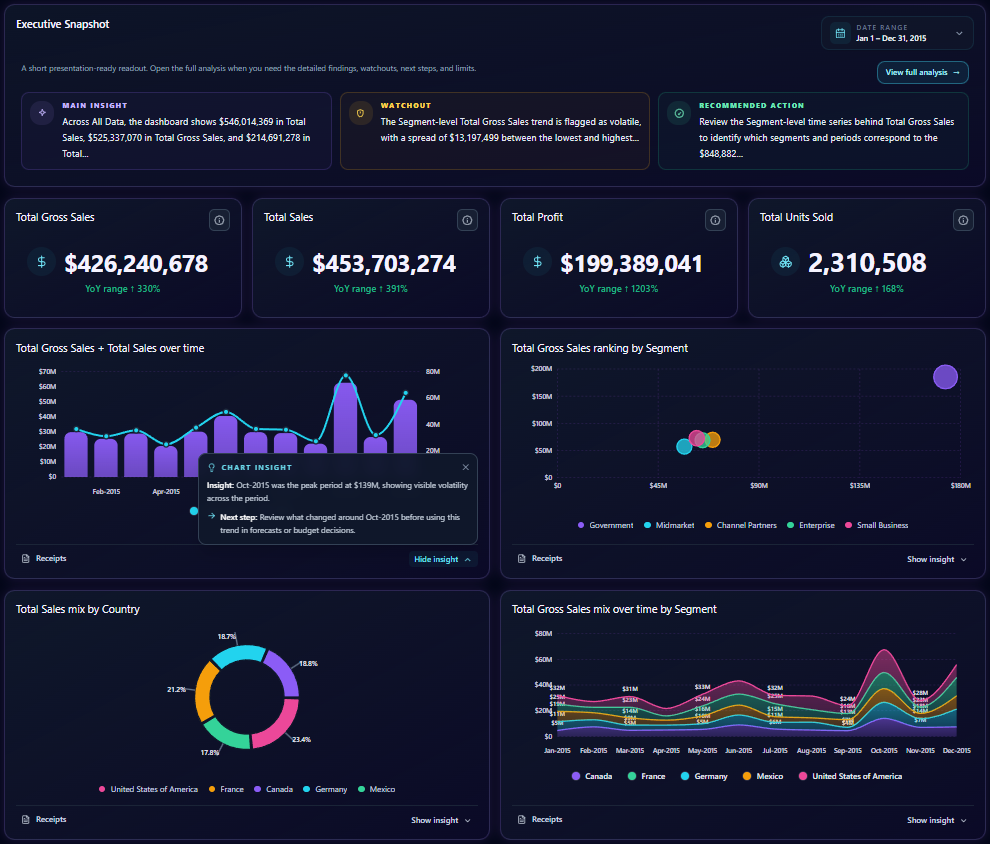
From spreadsheet export to clearer report
The homepage promise is simple: help users understand spreadsheet data faster, with enough structure and transparency to trust what they are seeing.
Check if a spreadsheet looks dashboard-ready before turning it into KPI cards, charts, summaries, and reports.
Surface the columns, totals, categories, and trends that matter before you spend hours building a spreadsheet report.
Show users what was detected from the file, then turn those signals into dashboard previews and explainable insights.
Upload CSV or Excel
Start with the export you already have from a spreadsheet, marketplace, CRM, finance tool, or operations tracker.
Check if it is dashboard-ready
Review clear headers, consistent rows, numeric fields, categories, and possible structure issues before previewing a report.
Generate clearer reports
Move from raw rows into dashboards, insights, summaries, and reporting views without rebuilding everything manually.
Structure readiness
Clear headers · usable fields · enough rows for preview
KPI candidates
Total Sales · Total Profit · COGS · Units Sold · Gross Margin
Chart direction
Trend over time · Category breakdown · KPI cards · Top / bottom views
Instant summary
A plain-English readout of what the file shows before users build the full dashboard.
Don’t have structured data yet? Start with a template.
If users are not ready to upload a clean spreadsheet, ready-made templates help them start with the right structure, avoid messy setups, and collect dashboard-ready data from the beginning. Templates are in beta, so some setup and deployment behavior may change as the experience improves.
Templates are the fallback path for clean data creation.
DataGrid Studio should still help users who know what they want to track but do not know how to organize it yet. Templates give them a starter table, workflow, and reporting structure without making the hero feel split. This beta path is usable today and will continue to improve.
Choose a ready-made template
Pick a starter structure for the workflow you want to track, such as inventory, budget, bookings, content, or projects.
Collect cleaner data
Use built-in fields, forms, and tables so your records are easier to analyze later.
Turn structure into reporting
Once your data is organized, generate dashboards and insights from the same clean workflow.

Inventory & Sales
Built for faster, clearer spreadsheet reporting
The product can start from an upload or a template, but the outcome stays consistent: cleaner data, clearer dashboards, and easier reporting.
Spreadsheet upload
Import CSV or Excel exports and quickly understand what the file contains.
Instant dashboard signals
Detect useful fields, KPIs, groupings, and chart directions from the uploaded data.
Insight summaries
Turn spreadsheet rows into plain-English observations your team can understand quickly.
Ready-made templates
Start with structured data collection when you do not have a clean spreadsheet yet.
Simple, transparent pricing
Start free with one-time starter credits, then upgrade when you need ongoing AI usage and live template capacity.
Free
- 30 one-time starter AI credits
- AI credits are used only for dashboards, AI insights, and Formula + Code Helper
- Template creation does not consume AI credits
- Create up to 2 template drafts
- No live template deployment on Free
- Upload up to 5MB per dataset
Premium – Monthly
- 500 AI credits/month
- Credits reset monthly while subscribed
- AI credits are used only for dashboards, AI insights, and Formula + Code Helper
- Template creation does not consume AI credits
- Up to 6 template drafts
- Up to 3 live templates
- Upload up to 25MB per dataset
Premium – Yearly
- 500 AI credits/month
- Credits reset monthly while subscribed
- Equivalent to $5.83 / month
- Save 2 months free
- Up to 6 template drafts
- Up to 3 live templates
- Upload up to 25MB per dataset
Need more details about our plans?
Turn your next spreadsheet export into a clearer report.
Use the upload path when you already have data, or start with a ready-made template when you still need a clean structure.